How to draw Fibonacci Retracements (2024)
25/03/2024
Wondering how to draw Fibonacci Retracements?
Have you ever noticed markets rarely move in a straight line? Prices tend to surge, then pull back a bit, before continuing their journey. Fibonacci retracements are a tool that helps traders identify these potential pausing points, also known as support and resistance levels.
Imagine a giant elastic band stretched between two poles. When you pull on it, it stretches, but it also has a natural tendency to snap back to its original position. Price movements can behave similarly. Fibonacci retracements help us visualize those potential "snap back" zones.
The Magic Numbers: Decoding Fibonacci Ratios
To draw Fibonacci Retracements, you first need to understand the mathematical sequence upon which Fibonacci Retracements are built.
But don't worry, you don't need to be a math whiz! Here are the key Fibonacci ratios used in trading:
23.6%
38.2% (a very important level)
50% (a common support/resistance level)
61.8% (another significant level)
78.6%
These ratios represent potential retracement levels, or pullbacks, from a price swing.
But, what about the tools used to draw Fibonacci Retracements?
The good news is you don't need a special compass or ruler to draw Fibonacci retracements. Most charting platforms you'll use for trading will have a built-in Fibonacci retracement tool.
Here's a general breakdown of the steps (remember, specific instructions may vary depending on your platform):
Spot the Swings:
Look for the prominent high and low points on the chart, also known as swing highs and swing lows. In an uptrend, the swing low will be the starting point, and the swing high will be the endpoint. The opposite is true for a downtrend.
Let the Tool Do the Math and discover how to draw Fibonacci Retracements:
First, select the Fibonacci retracement tool and click on the starting swing point (low point in uptrend, high point in downtrend). Then, drag the tool to the ending swing point. The magic happens here - the platform automatically calculates and displays the Fibonacci retracement levels (23.6%, 38.2%, etc.) on your chart.
So now you know how to draw Fibonacci Retracements, but how do you interpret the results?
Once you know you to draw Fibonacci Retracements, understanding how to interpret these levels is crucial for making informed trading decisions. Here's what each level signifies:
23.6%: This level indicates a shallow retracement. It suggests that the trend may continue after a minor pullback.
38.2%: This level is considered a moderate retracement. It's a common level for price to retrace to before resuming its trend.
50%: This level is not a Fibonacci number but is included in Fibonacci retracements. It often acts as a significant support or resistance level.
61.8%: Also known as the "golden ratio" or "golden mean," this level is considered a strong retracement level. Many traders watch this level closely for potential reversals or continuation of trends.
100%: This level represents a complete retracement of the prior move, essentially bringing the price back to its starting point.
Practical tips for Using Fibonacci Retracements:
Combine with Other Indicators: Fibonacci retracements work best when used in conjunction with other technical indicators such as moving averages, trendlines, and oscillators.
Look for Confluence: Pay attention to areas where Fibonacci retracement levels align with other support or resistance levels, increasing the significance of those levels.
Use in Different Timeframes: Fibonacci retracements can be applied to various timeframes, from intraday charts to long-term charts, to identify potential levels of interest.
Practice and Learn: Like any trading tool, mastering Fibonacci retracements takes practice and experience. Start by applying them to historical price data and analyzing how price reacts to different levels.
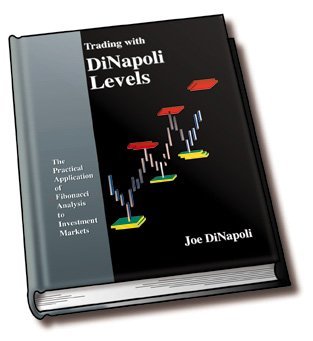
PS: If you're serious about leveling up your Fibonacci analysis, we'd highly recommend you check out the Best-Selling trading book, ''Trading with Dinapoli Levels'', by Joe Dinapoli - which is widely considered not just an exceptional trading book, but the most comprehensive trading book ever published on the practical application of Fibonacci analysis to the Price axis.

Conclusion: How to draw Fibonacci Retracements
Fibonacci retracements are a valuable tool for traders to identify potential levels of support and resistance in financial markets.
By understanding how to draw and interpret Fibonacci retracements, you can enhance your trading strategy and make more informed decisions.
Remember to combine Fibonacci retracements with other technical analysis tools and to practice using them in different market conditions to improve your trading skills over time.